Drawdown Chart: Evaluating Risk Management and Portfolio Performance
We're excited to introduce a new and exciting Parqet feature: The Drawdown Chart. This is made available specifically for our Plus and Investor plan subscribers and gives you a deeper insight into the performance of your investments.
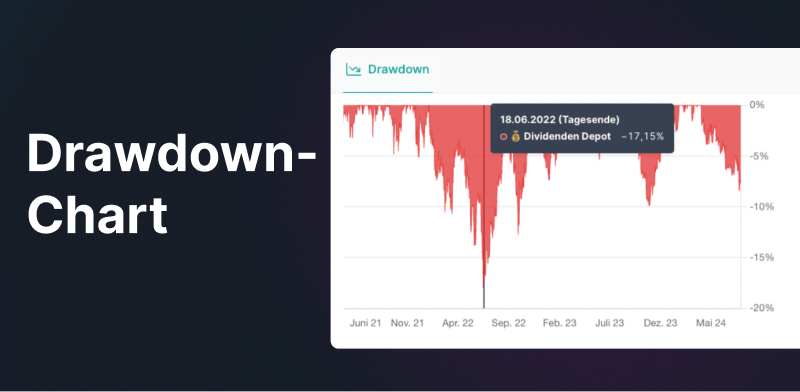
What Is a Drawdown Chart?
A drawdown chart shows the maximum loss (Maximum Drawdown) of an investment from a peak to a trough within a specific time period. This is particularly useful for assessing the risk and volatility of investments. When the value of an investment drops, you can see exactly how severe and how long the decline lasted before the investment stabilized again.
How Does the Drawdown Chart Work at Parqet?
The drawdown chart can be displayed for both an entire portfolio and for individual stocks or other securities.
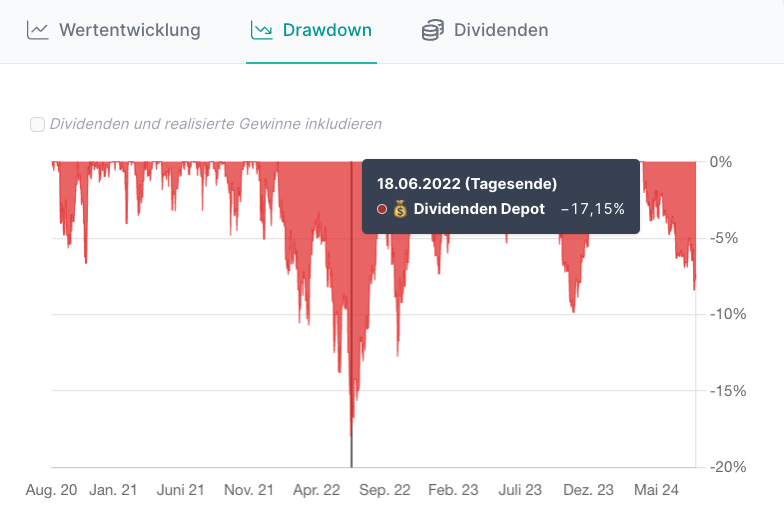
In the Dashboard: Here you see an overview of the drawdown of your entire portfolio. You can use this to track the fluctuations of your entire investment strategy. You can also choose whether dividends and realized gains should be included in the chart or not.
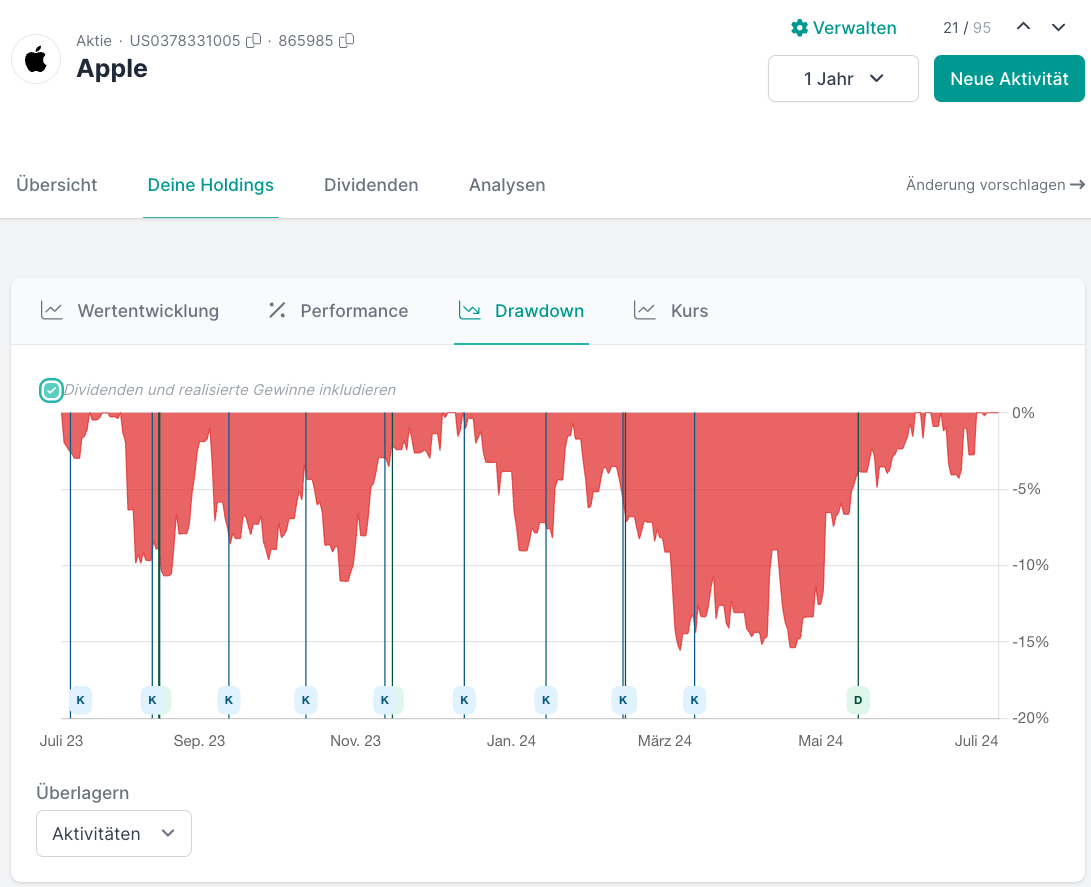
For individual Holdings: You can track the drawdown for each individual investment, which helps you understand which of your investments are particularly volatile. It's also possible here to show or hide the activities of the holding.
Why Is the Drawdown Chart Useful?
The drawdown chart helps to better assess the risk of an investment. You can see at a glance how investments have reacted to market fluctuations in the past, and conclusions can be drawn from this for future investments.
You can find detailed information on how the drawdown chart is calculated in our FAQ section. We look forward to your feedback and are excited to continue supporting you in successfully managing your finances. Try out the drawdown chart and share your experiences with us!
We Look Forward to Your Feedback!
Your feedback is enormously important to us. If you have questions about the drawdown chart or suggestions for additional features, we'd love to hear from you — via our contact form, in the corresponding community post, or in our feature voting tool.
Frequently Asked Questions
Do the filters on the dashboard page, such as flexible time periods, also affect the drawdown chart?
Through the filters on the dashboard page, you can set the desired time period for displaying the drawdown chart and then see the chart for that selected period.
Who can use the drawdown chart?
The drawdown chart is only available to Parqet subscribers.
New to Parqet?
At Parqet, we work every day to remove barriers to wealth building. We build tools that allow you to keep track of your portfolio effortlessly, whether at home or on the go.
See how Parqet can simplify your wealth planning, or create your free portfolio in seconds.
Create Portfolio